Inflow/Outflow Potential
Overview
No Constraints
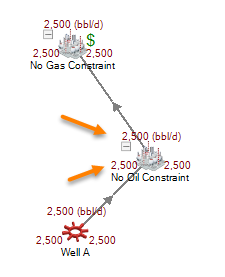
In the scenario below, a well’s production flows first to one facility, then on to a second where it is subsequently sold. As you can see, the potential flow of Well A is 2,500 bbl/d oil. That amount becomes the inflow potential at the facility called “No Oil Constraint”, and due to the fact that there is no constraint, the outflow potential to the next facility is also 2,500 bbl/d oil.
Click image to expand or minimize.
Click image to expand or minimize.
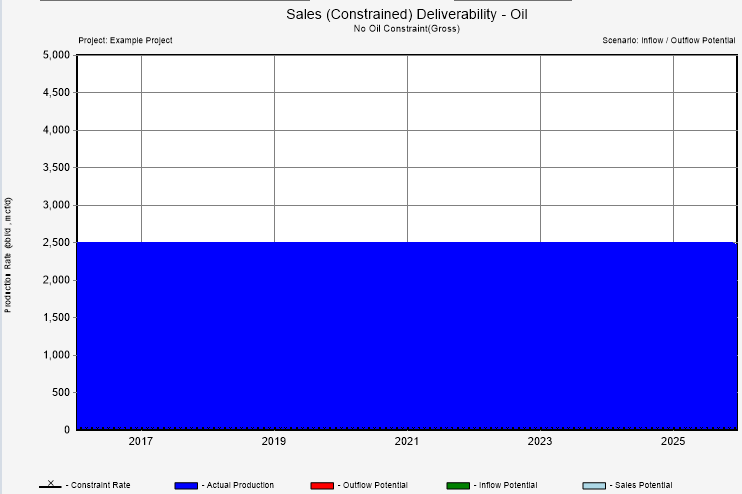
The blue area on this graph represents actual flow of production through the “Oil Constraint” node. There is no green nor red area on this graph due to the fact that no constraint is actually present; therefore, this well can flow to its full potential.
Oil Constraint Only
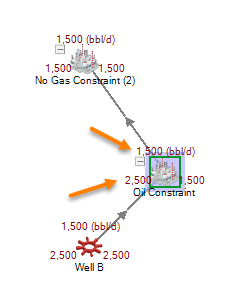
In the next scenario, Well B’s potential flow is still 2,500 bbl/d oil; however, there is a constraint present of 1,500 bbl/d of oil at the “Oil Constraint” facility in January 2017. You can see highlighted that the inflow potential into the “Oil Constraint” node is 2,500 bbl/d but the outflow is only 1,500 bbl/d.
Click image to expand or minimize.
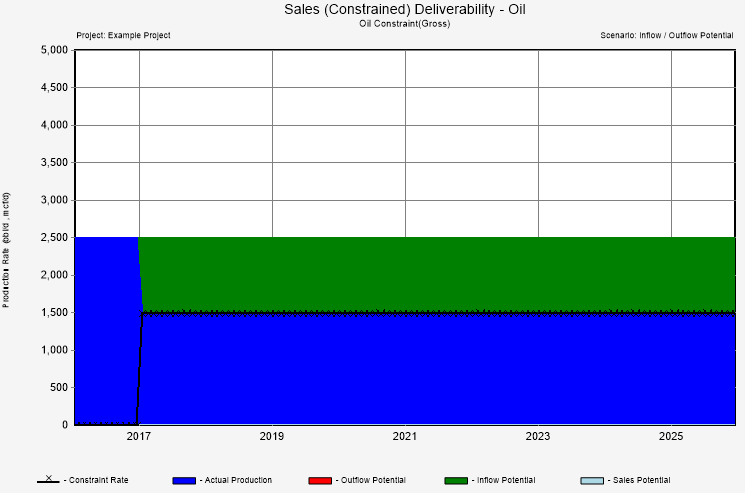
The presence of the constraint curtails the potential of that well and reduces it to the constrained amount. This is also visible in the Ullage Graph for oil.
Click image to expand or minimize.
The blue area on this graph represents actual flow of production through the “Oil Constraint” node. The green area on this graph represents production that could flow through the “Oil Constraint” node if a constraint was not present. The black line represents the constrained oil rate.
Oil and Gas Constraint
In this scenario, Well B’s potential flow is still 2,500 bbl/d oil and the constraint of 1,500 bbl/d of oil is still present at the “Oil Constraint” facility in January 2017. We have also added a second constraint of 500 mcf/d gas beginning in January 2017.
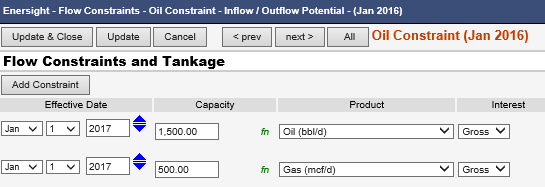
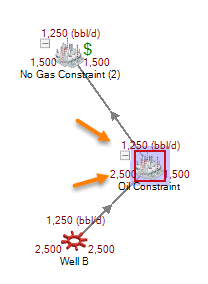
In this scenario below, while both constraints are present only one is highlighted (gas). This is because the gas constraint is reached first, therefore the gas and oil potential is curtailed. The outflow potential for oil is now only 1,250 bbl/d as opposed to the 1,500 bbl/d with only an oil constraint present. The difference in volumes is due to the fact that even less than 1,500 bbl/d of oil can flow because a gas constraint of 500 mcf/d is reached even before 1,500 bbl/d of oil can be reached.
Click image to expand or minimize.
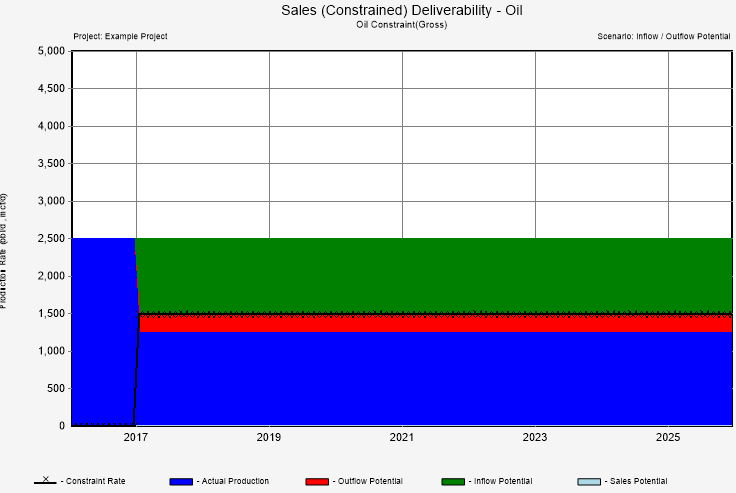
The presence of the gas constraint curtails the potential of that well’s flow of oil even below its own present constraint and reduces it further. This is also visible in the Ullage Graph for oil.
Click image to expand or minimize.
The blue area on this graph represents actual flow of production through the “Oil Constraint” node. The green area on this graph represents production that could flow through the “Oil Constraint” node if an OIL constraint was not present. The red area on this graph represents even more oil production that could flow through this node had the GAS constraint not been present. The black line represents the constrained oil rate.
